Difference between pages "File:GroupByBox.jpg" and "Data Tables"
(→Group Data Tables) |
|||
| Line 1: | Line 1: | ||
| + | {{topic|AquilaCRS}} | ||
| + | |||
| + | =About Data Tables= | ||
| + | |||
| + | Tabular data in AquilaCRS is presented inside a commonly used visual component; the Data Table: | ||
| + | |||
| + | [[File:Aquilacrs data table example.png]] | ||
| + | |||
| + | Every data table has the following key features: | ||
| + | |||
| + | * Sorting | ||
| + | * Filtering | ||
| + | * Grouping | ||
| + | |||
| + | Right click on any column header to access a menu of all the functions of any data table. | ||
| + | |||
| + | [[File:Data table popup menu.png]] | ||
| + | |||
| + | == Sorting == | ||
| + | |||
| + | To sort a data table by a column, click on the column header (avoiding the right hand edge of the column header which is reserved for filtering options). | ||
| + | |||
| + | To indicate a table is sorted by a specific column, that column will show a up or down arrow to the right hand side. Up or down indicates the direction of the sort, ascending or descending. | ||
| + | |||
| + | To sort by multiple fields: | ||
| + | * Click on the first column header. | ||
| + | * Hold down the ''Shift'' key and click on the secondary sort columns in the order you require. | ||
| + | |||
| + | == Filtering == | ||
| + | |||
| + | Hover your mouse over a column header to reveal a small filter icon. Click this and you will be presented with a drop down list of all the distinct values in the sub-set of data that the table represents, plus ''(All)'' and ''(Custom)'' options. | ||
| + | |||
| + | [[File:Data table filtering.png]] | ||
| + | |||
| + | * Ticking individual values will include that value in the data table. You can tick more than one box to easily create complex filters. | ||
| + | * Select the ''(All)'' option again to show all records. | ||
| + | * Select the ''(Custom)'' option to show a filter builder screen to allow you to specify more complex filters. | ||
| + | |||
| + | You can filter on more than one column simultaneously to create complex filters. | ||
| + | |||
| + | When the data table has been filtered, the column header shows a highlighted filter icon, and the filter itself is displayed at the foot of the data table. The ''Customise...'' button has the same effect as selecting ''(Custom)'' from the drop down. | ||
| + | |||
| + | [[File:Data table filtered.png]] | ||
| + | |||
| + | The '''X''' to the left of the filter will remove the filter and show all records again. | ||
| + | |||
| + | The tickbox will disable/enable the filter without completely removing it. | ||
| + | |||
| + | The drop-down arrow to the right of the filter text shows recently used filters so you can easily switch. | ||
| + | |||
| + | ==Group Data Tables== | ||
| + | |||
| + | To group the fields right click over the selected column, on the options list, Group By This Field and Group By This Box will be displayed amongst the other options above. | ||
| + | |||
| + | Group By This Field = Click on the selected field header and choose Group By This Field, the data will be grouped, by the header chosen. Further grouping can be added by adding further field headers to the group by list. | ||
| + | |||
| + | [[File:GroupByList.jpg]] | ||
| + | |||
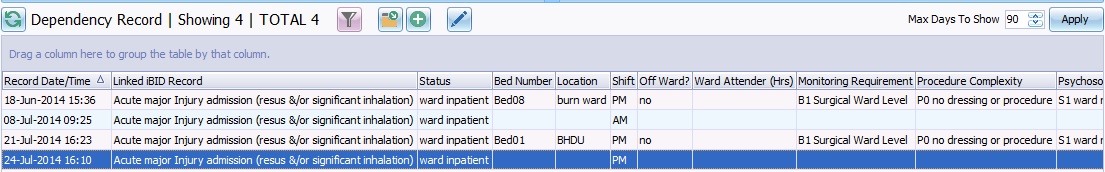
| + | Group By Box = The Group By Box displays the grouping box above the field headers in the grid. To display the grouping box, right click and choose the grouping box option in the list. List will be displayed as above. | ||
| + | |||
| + | To add items to the grouping box, click on the header and drag to the Group By Box, to remove drag header back to the list, to remove this box click Group By Box option in the drop down list again. | ||
| + | |||
| + | [[File:GroupByBox.jpg]] | ||
| + | |||
| + | |||
| + | |||
| + | |||
| + | |||
| + | |||
| + | |||
| + | |||
| + | [[Category:iBID]] | ||
| + | [[Category:AquilaCRS]] | ||
| + | [[Category:User Help]] | ||
Latest revision as of 15:42, 26 August 2014
This topic is for AquilaCRS
About Data Tables
Tabular data in AquilaCRS is presented inside a commonly used visual component; the Data Table:

Every data table has the following key features:
- Sorting
- Filtering
- Grouping
Right click on any column header to access a menu of all the functions of any data table.

Sorting
To sort a data table by a column, click on the column header (avoiding the right hand edge of the column header which is reserved for filtering options).
To indicate a table is sorted by a specific column, that column will show a up or down arrow to the right hand side. Up or down indicates the direction of the sort, ascending or descending.
To sort by multiple fields:
- Click on the first column header.
- Hold down the Shift key and click on the secondary sort columns in the order you require.
Filtering
Hover your mouse over a column header to reveal a small filter icon. Click this and you will be presented with a drop down list of all the distinct values in the sub-set of data that the table represents, plus (All) and (Custom) options.

- Ticking individual values will include that value in the data table. You can tick more than one box to easily create complex filters.
- Select the (All) option again to show all records.
- Select the (Custom) option to show a filter builder screen to allow you to specify more complex filters.
You can filter on more than one column simultaneously to create complex filters.
When the data table has been filtered, the column header shows a highlighted filter icon, and the filter itself is displayed at the foot of the data table. The Customise... button has the same effect as selecting (Custom) from the drop down.

The X to the left of the filter will remove the filter and show all records again.
The tickbox will disable/enable the filter without completely removing it.
The drop-down arrow to the right of the filter text shows recently used filters so you can easily switch.
Group Data Tables
To group the fields right click over the selected column, on the options list, Group By This Field and Group By This Box will be displayed amongst the other options above.
Group By This Field = Click on the selected field header and choose Group By This Field, the data will be grouped, by the header chosen. Further grouping can be added by adding further field headers to the group by list.

Group By Box = The Group By Box displays the grouping box above the field headers in the grid. To display the grouping box, right click and choose the grouping box option in the list. List will be displayed as above.
To add items to the grouping box, click on the header and drag to the Group By Box, to remove drag header back to the list, to remove this box click Group By Box option in the drop down list again.

File history
Click on a date/time to view the file as it appeared at that time.
| Date/Time | Thumbnail | Dimensions | User | Comment | |
|---|---|---|---|---|---|
| current | 15:29, 26 August 2014 | 1,105 × 172 (93 KB) | Jan (Talk | contribs) |
- You cannot overwrite this file.
File usage
The following page links to this file: