EventStats Quick Start
A quick introduction to importing and analysing a CSV file in EventStats.
Contents
Importing a CSV Data File
Note: Source CSV files must have less than 256 columns
Click the Import CSV... button which opens the Import CSV File wizard
Click the Open CSV File button and select your data file.
EventStats will analyse the first 200 rows and present you with the column structure and a sample of the data file.
Please pay no attention to date fields interpreted as a string field, conversions to dates will take place during the analysis process
You must now modify the Column Definitions to tell EventStats what each field is for:
- Record Key: this is the field that uniquely defines every record in the data file.
- Enter a Y (or y) in the Is Key column on the appropriate row.
- There can only be one field marked as Record Key.
- Group/Filter/Data: enter a 'Y' (or a name) in this column to flag that it's to be used for either analysis groups, filtering or as the data-field for sum functions.
- Enter either a 'Y' or a name directly.
- You can specify as many as you want - each field with a Y or a name will be imported and available to use.
- You must use a different name for each Group column (if using names)
- Date index: enter a numerical value to identify this field as a date field in the Date index column.
- Odd numbers are start dates, even numbers are end dates.
- Pair dates together by using consecutive numbers, i.e. 1&2,3&4,5&6 and so on. e.g. If Admission Date is date index: 1, Discharge Date is then naturally date index 2.
- Multiple pairs of dates can be specified - you can choose which to analyse in the next step.
- To specify a single date field, just give it the next available odd number & do not allocate the even number to any field.
Only fields that are marked as the record ID, or as a grouping/filtering/data field, or have a date index field will be imported
Example configuration:
In the above example, the Referral Date field will not be imported. You can click on the field name or data type values to open a window where you can change the field name, data type and all the other properties listed above.
Note also, that the CSV data is now editable. Records can be inserted, deleted and edited directly in the grid, and the CSV file can be saved using the Save CSV data and Save CSV data as... options in the file menu.
Finally click the OK button to actually import the CSV file.
Running Analysis
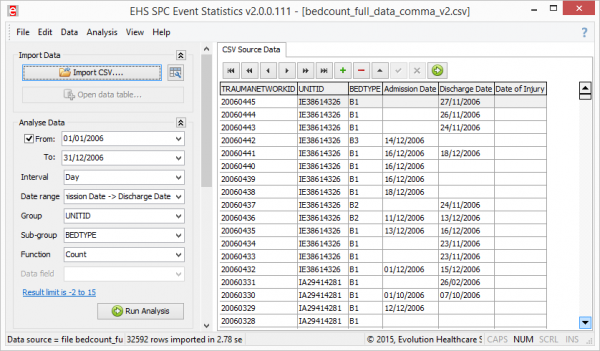
With the data file loaded, you can now filter your data, and specify your analysis parameters.
Note: the small button to the right of the Import CSV button allows you to edit the column structure if you need to make any adjustments. This option is also available in File > Edit Columns....
Filtering
- Use the column headers in the CSV Source Data grid to filter the source data. Only visible records will be included in the analysis.
- Use the Custom... option to specify more complex filters
- No need to filter date fields, this is done in the analysis section.
Analyse Data
- Select the From and To dates to analyse a limited range of records. This is highly recommended to prevent extensive processing times
- Pick your chosen interval from the list.
- Day is the most common choice, although for longer date ranges weekly and monthly are also appropriate.
- Only use intervals smaller that day for dates containing time data.
- Choose the date fields to analyse from the Date field list. You will see the date fields you specified during the import process.
- Select the grouping and sub-grouping levels you require.
- You will be able to view results for all groups or by sub-group values within the group values. (More info in the results section)
- Select your required function:
- Count : counts records per interval value (e.g. per day). Example: bed occupancy when using admission - discharge data
- Cumulative Count : counts records per interval, but the values are carried over to the next interval.
- Sum : calculates the sum of the value in the specified data field for the specified time interval. Example: Organ Support Numbers per day
- Cumulative Sum: calculates the rolling total for the specified data field. Example: calculating daily mortality prediction score totals.
- Select the data field that provides the values to the sum or cumulative sum function
- Limits: click this link to adjust the data limit parameters.
- Limits disabled - has no effect on the results.
- Limits enabled - ensures that the results are kept within the specified range, by subtracting the upper (or lower) limit values from the result total.
Press Run Analysis to process the file and show the first set of results.
Always check the Exception Report to see which source records were excluded from the analysis. Some of the issues encountered in the exception report can be overcome by the analysis settings (more info needed)
Results
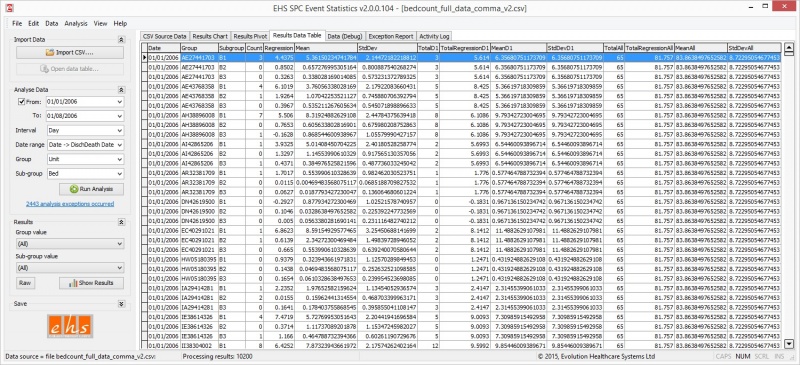
Results are presented as a chart, a customisable pivot table and a table of raw results. There is also an exception report and a limited activity log. Each is presented in their own tab.
Initially the total results for all groups and sub-group values are shown. You may like to drill down in to these results by changing the values in the Group and Sub-group fields on the left, and pressing the Show Results button.
You can show the results on the chart for any of the following combinations:
- All Group values by all Sub-group values
- Specific Group value by all Sub-group values
- Specific Group value by a specific sub-group value.
If you need to show data on the chart for a specific Sub-group value with "All" group values, you will need to re-analyse the data. Swap the group and sub-group fiel names and press Analyse. This way the group values become the sub-group, and vice versa.
Results Chart
As the screen shot above shows, the chart contains the results line and also the bivariate regression (best fit) line, the mean, sample standard deviation and margin of error data.
The various data series can be toggled via the checkboxes on the chart legend.
The chart can be zoomed by dragging a rectangle from top-left to bottom-right anywhere on the chart. Zoom out by drawing a rectangle from bottom-left back to top-right.
Results Pivot
The pivot table is initially set up for you, but can be customised according to your needs.
You can alter the pivot table by moving fields around to the various sections in the table: data, row, column and filter.
The group and sub-group values are combined to make the column values. The group only is used if there is no sub-group value.
Results Data Table
This data table is provided for reference purposes and is saved as an Excel spreadsheet (see later for Saving options).
The data contains the following columns:
- Date: the event date-point. There is one date per unique group & sub-group value.
- Group: a distinct value from the field selected as the group field in the analysis.
- Subgroup: a distinct value from the field selected as the sub-group field in the analysis.
- Count: number of records in the CSV data file for that date, group and sub-group combination.
- Regression: the actual value of the best fit line - again per date, group and sub-group combination.
- Mean & StdDev: the mean & sample standard deviation, per date, group and sub-group combination.
- TotalD1: number of records in the CSV data file for that date and group combination. This count field excludes the subgroup field.
- TotalRegressionD1, MeanD1', StdDevD1: Best fit, mean & sample std dev values per date & group value (excluding the subgroup field)
- TotalAll: number of records in the CSV data file for that date. Excludes any grouping. This field is the total of all records for that date.
- TotalRegressionAll, MeanAll, StdDevAll: best fit, mean and sample std dev values for all records for that date. Excludes any grouping.
Notes
- All fields ending in ...D1 or ending in ...All will have repeating values, as they are calculated without various grouping levels. In order to view these fields correctly, you should filter the data table by a single group value and a single sub-group value. The actual value of the group and sub-group values does not matter where the All fields are concerned, and for the D1 fields, you should specify the group value you are interested in, and choose any sub-group value.
Saving Results
Result are saved as separate files inside a selected folder. The current grouping values in the Results section are used as sub-folders to prevent overwriting of files when saving multiple times.
The saving of each file type is optional:
- the current chart image as a JPG
- an Excel worksheet representing the raw results data
- the same raw data as a proprietary data file
- an Excel worksheet which is a copy of the pivot table (not an actual pivot table)
- the original CSV source data
- the Exception report as an Excel worksheet.
In the Save section, tick the boxes next to each item to save, and press the Save Results button. You will be asked to select a folder into which the results files will be saved.
If you have changed the grouping values in the Results section since the last time the results were saved and you press Save Results - the results are updated prior to the save to ensure your results are saved as you expect them. This is a relatively quick way of saving lots of results. Just change the group/sub-group values, press save results & repeat.


